
Soil Organic Carbon (SOC) is a term used to describe the carbon component found within soil organic matter (SOM) and is derived from decomposed plant and animal matter. SOM is the vital ingredient for healthy soils and plays a major role in soil fertility, soil structure and stability, microbial activity and climate change mitigation. In this blog, I make an attempt to highlight some important sections of this prediction of SOC from Sentinel 2 Imagery using the open access article from MPDI - https://www.mdpi.com/3453870
The mdpi article describes in scientific detail the methodology and mathematics used to determine SOC in salt affected agricultural lands in Portugal. What inspired me about this article is the relationship of Sentinel 2A imagery data and the method in which a prediction on SOC is made. This has been done in a systematic manner - NDVI (Normalized Difference Vegetation Index) ratios, NBR2 (Normalized Burn Ratio 2) index and the BSI index (Bare Soil Index) are used to calculate and analyze reflectance values. It says in the article "the combined use of these indices have been found to be effective in distinguishing bare soil from other land covers". SOC is a key sign of soil health and fertility. It is essential for the productivity and sustainability of agricultural systems. Recent improvements in remote sensing technology especially the access to detailed satellite images from missions like Sentinel-2 have created new chances to evaluate SOC on a large scale.
The paper goes on to describe the importance and need to highlight soil texture variability and its impact on SOC using Sentinel data. It says "For remote sensing applications aimed at predicting SOC, it is important to consider how soil texture and organic matter content are correlated. When SOC and soil texture follow similar or opposing spatial patterns, their combined influence on surface reflectance may enhance prediction outcomes. On the other hand, if their spatial variability is independent, soil texture effects may interfere with the spectral signals related to SOC, potentially diminishing model reliability". The STEROPES Project funded by the European Joint Program (EJP SOIL) explores via efforts with other European countries to study and explore how various soil properties affect SOC predictions across diverse agricultural fields. A list of papers can be found here: STEROPES
For the purpose of this article, we concentrate on what Spectral Hemisphere can do with satellite imagery in relation to the mdpi article and the steps we take to understand SOC from a satellite imagery perspective. Sentinel 2 Level 2A data is mosaicked from between 03-Aug-2025 and 04-Aug-2025.A false color composite is applied, and the following is an image with a 60m resolution with healthy vegetation at band 8 for Red, band 11 for Green and band 2 for blue.

Sections in red highlight healthy vegetation. How healthy is this vegetation?
That's where the paper provides some real insights based on ground truth data and satellite spectral data selection. The paper describes the location of the agricultural fields, the sampling points, the dominant land use across the study area and the methodology to measure SOC from 63 composite samples at a depth of 0-20cm in a grid pattern from October 2022 to March 2023.
With regards to spectral data selection, the three spectral indices described - NDVI, NBR2 and BSI are used in combination to distinguish bare soil from other land covers. Once again the acquisition dates are different here and this is done on purpose to highlight subtle differences in analysis based on dates.

The above image represents the NDVI for a section of the study area and from the calculation of this index, we determine the minimum and maximum values, for which all of the reflectance values fall under 1. Negative values mainly represent clouds, water and snow, and values close to zero are primarily from rocks and bare soil, conversely values close to 1 represent healthy vegetation. This article from science direct is great read on interpreting NDVI values: Demystifying normalized difference vegetation index (NDVI) for greenness exposure assessments and policy interventions in urban greening - ScienceDirect
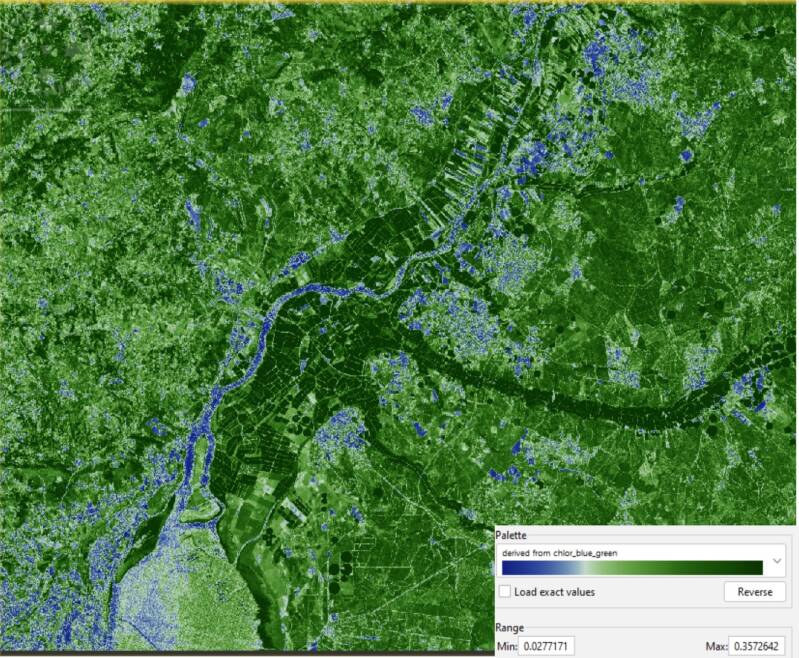
Diagram above is a visual representation of the NBR2 with values ranging from 0.02 to 0.35.
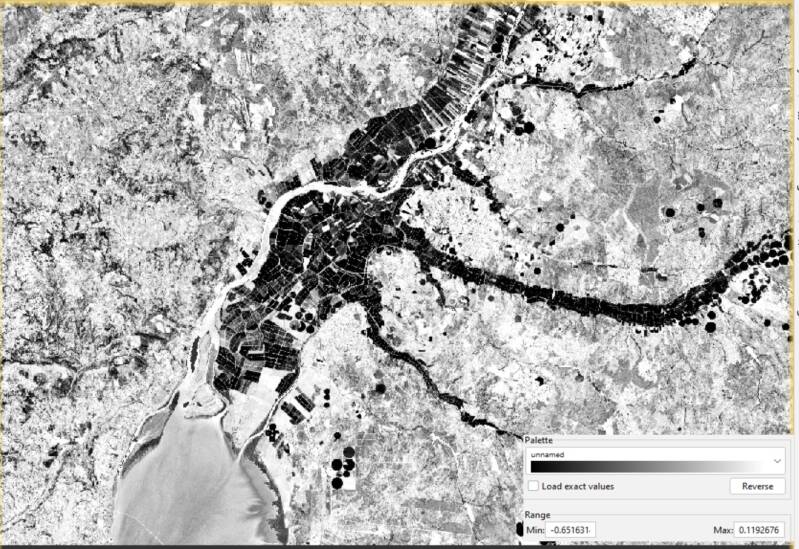
This diagram above represents the bare soil index with values ranging from -0.65 to 0.1
What is the point of all of these indices you might ask?
These indices form the foundation for regional calibration which in turn proves the prediction of SOC using Sentinel data to be accurate for the sample size and study area.
The article describes how this is done using the following table.

The table describes the bands involved and the formulas used in the calculations. The two modelling approaches used here are the Partial Least Squares Regression and the Linear Regression method. In this particular case study, a small dataset of 63 samples is used to determine the results. Also, PLSR is suitable here for remote sensing applications as it reveals the impact of spectral bands on soil properties and is less susceptible to over fitting, consequently providing better accuracy.
I won't go into the analysis or the results, as this blog is not what that is about. The purpose of this blog is to highlight the capability of what Spectral Hemisphere can offer in soil characteristic determination. While the images used for this blog were on a particular date range, the highlight in data acquisition for this paper needs to be noted based on regional calibration of per pixel mosiacking across seasons which is possible with imagery acquisition! It goes on to conclude that while field-based validation is accurate, regional calibration with imagery data on a per pixel approach can provide undeniable accuracy as well from an agronomic and soil management perspective.
Add comment
Comments